Purpose of this post is to describe playbook utilising template files (in .j2 format) used to install and configure Elasticsearch and Kibana to run in a tandem.
First, let’s have a look at main playbook:
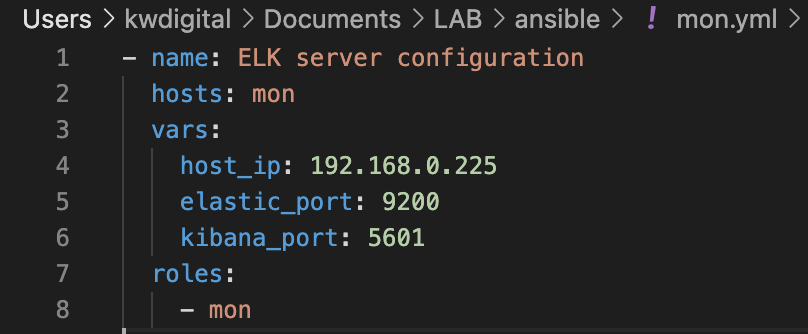
Beside specifying hosts to which it should apply and roles to deploy, in this playbook I am using variables to specify configuration of this installation instance. For simplicity I kept it down to just few chosen examples, like IP address of Elastic host, and ports, but ceiling is high when it comes to customising installation with variables.
In order to modify installation to our needs we use configuration files (or actually their templates) in .j2 format, in which we can refer to previously specified variables. Here is an example:
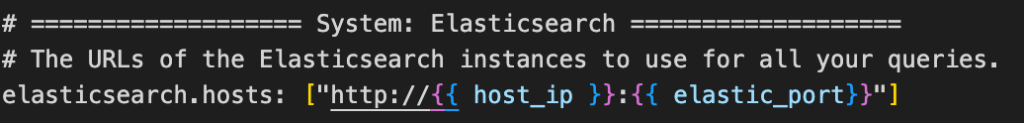
One of the settings we need to specify in Kibana configuration are URLs of Elasticsearch hosts. The URL has a format of protocol://host_ip:port. To not make this example to complicated I stick to http and I am refering to previously estabilshed variables of host_ip and elastic_port to provide full information of URL which needs to be used.
If we take a look at actual deployed configuration file, you will be able to see that Ansible replaces variable references with values assigned to them:
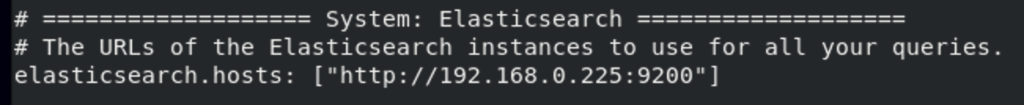
This is a great way to make our playbooks flexible and reusable when creating multiple environments.
Anyway, here is full role playbook consisting all the steps. As usual you can find it on my Github.
At first glance it might look complicated, however the commands are fairly simple. Tasks consist of making sure that required ports are open (in this one I am also using variables again), adding repositories, installing actual software, copying configuration from .j2 templates and making sure that services are started and enabled.
After running the playbook with command:
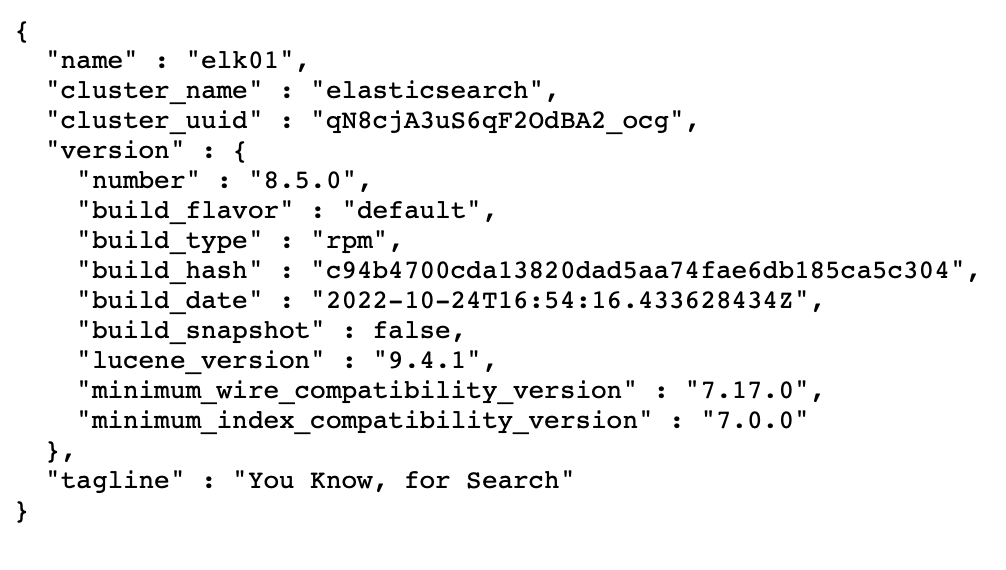
./ansible-playbook mon.yml You should verify that installed products are accessible. Open any Internet browser on your host machine and open Elasticsearch address: http://192.168.0.225:9200/. You should be able to see about of Elasticsearch engine, similar to the one below:
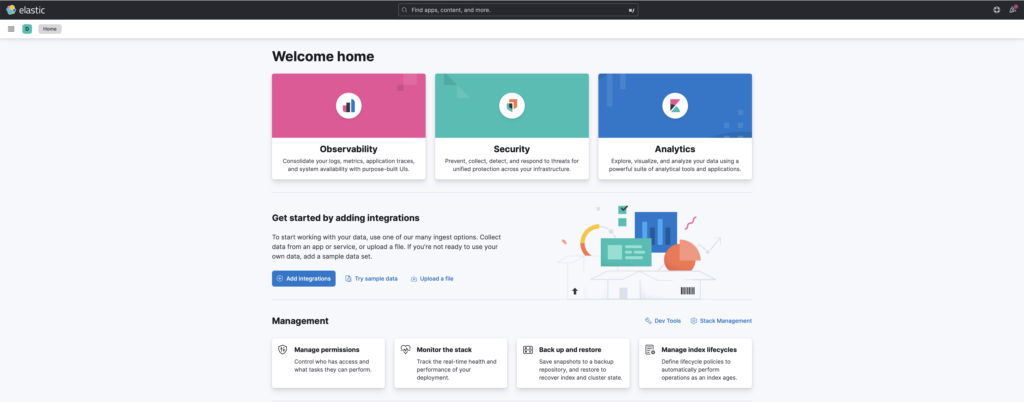
Make sure to check out Kibana too! You can do it by typing http://192.168.0.225:5601/ in your browser. You will be redirected to Kibana mainpage, which looks like this:
I hope you that you found this entry interesting and helpful.
In my next blog post I will cover installation of missing “L” in “ELK”, which is Logstash as well as reading logs from Tomcat instance in Docker.